
IndustryLindsay SaundersThu 24 Sep 26
RLB Crane Count Hits Record High Despite Construction Headwinds

Australia’s construction market has reached a record level, with 896 cranes operating across the country in the third quarter of 2026 as activity strengthened across Melbourne, the Gold Coast and several other major markets.
The latest RLB Crane Index recorded 210 points, with crane numbers increasing 6.7 per cent during the six months to the third quarter of the year.
Rider Levett Bucknall Oceania director of research and development Oliver Nichols said the result highlighted continued strength across residential and non-residential construction, alongside significant differences between individual markets.
Melbourne recorded its highest crane count on record at 224, surpassing its previous peak of 222 for the first quarter of 2019.
The city added a net 21 cranes over the six months, with residential projects accounting for 48 per cent of the total, up from 41 per cent in the first quarter.
Data centre and industrial construction also increased, with 31 cranes operating across the sectors, compared to 20 in the first quarter.
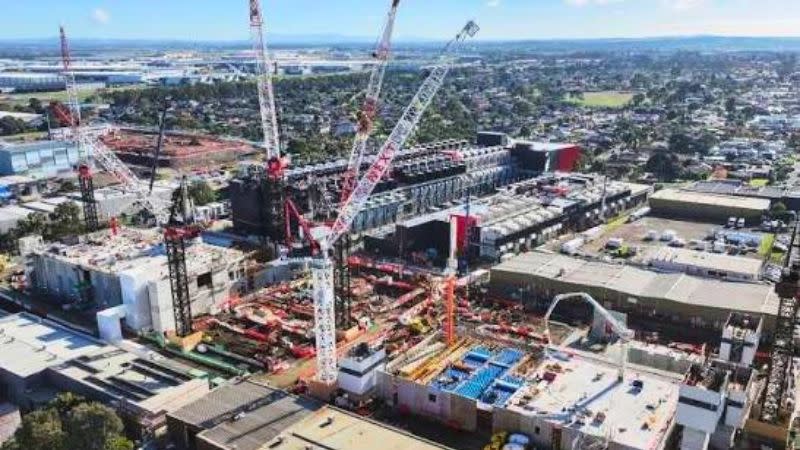
Major projects include the NEXTDC M2 expansion at Tullamarine, LA1 Laverton, STACK Infrastructure MEL02 in Truganina and Amazon Web Services at Cobblebank.
The North East Link and Suburban Rail Loop account for a combined 42 cranes—19 per cent of Melbourne’s total.
Sydney remained Australia’s largest crane market despite recording a further decline, falling from 346 cranes in the first quarter to 336 in the third.
Its index fell from 214 to 207 points, with residential projects accounting for 189 cranes, or 56 per cent of the city’s total.
Mixed-use and other projects account for another 91 cranes, meaning residential and mixed-use projects make up 83 per cent of Sydney’s crane activity.
Sydney North recorded the largest decline, falling from 110 to 97 cranes, while Sydney South increased by six cranes to 46 and Sydney Inner rose to 78.
Major projects continue to support activity across the city, including Arncliffe Central, The Carling in Carlingford, The Rise at Pemulwuy, the Marsden Park Data Centre and developments in the CBD and Parramatta.
South-East Queensland recorded a significant increase, with its crane count rising from 153 to 178.
RLB Crane Index Third Quarter 2026
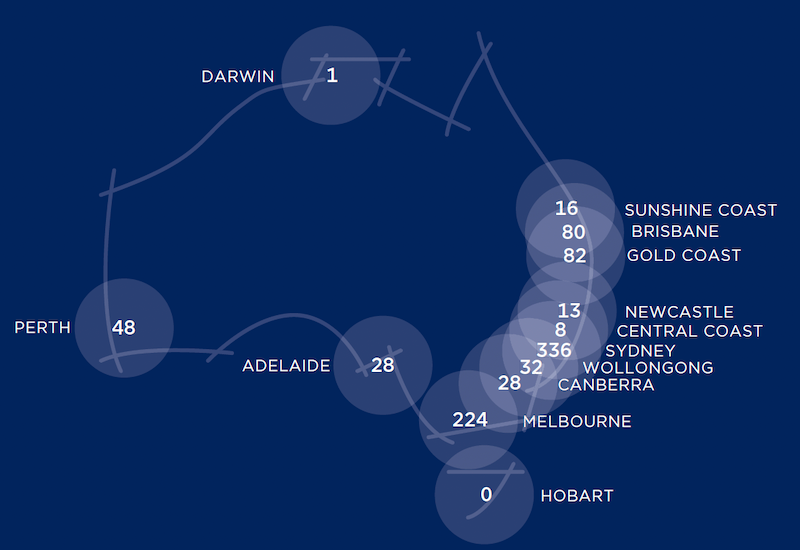
Brisbane increased from 70 to 80 cranes, while the Gold Coast reached a record 82, taking it ahead of Brisbane.
Residential projects account for 137 cranes, or 77 per cent of South-East Queensland’s total.
The Gold Coast added 30 cranes while 23 were removed, resulting in a net increase of seven and taking the market to its new record.
Residential projects account for 88 per cent of Gold Coast cranes, with additional activity across aged care, mixed-use, commercial and data centre and industrial projects.
Other markets also recorded growth.
Perth increased from 40 to 48 cranes, with residential projects accounting for 56 per cent of activity, while health projects including the New Women and Babies Hospital and St John of God Oncology Facility contributed to the broader pipeline.
Canberra increased from 22 to 28 cranes, with commercial activity rising to 10 cranes while residential remained the largest sector.
The Sunshine Coast doubled its crane count from eight to 16, driven by residential development alongside data centre and hotel projects.
Wollongong and Shellharbour increased from 25 to 32 cranes, including activity at Port Kembla’s No. 6 Blast Furnace and the New Shellharbour Hospital.
Adelaide remained close to its record at 28 cranes, while Newcastle increased from 10 to 13.
Darwin was the only market outside Sydney to record a notable contraction, falling from four long-term cranes to one, with activity concentrated on the Darwin Civic Centre.
Nationally, 370 cranes were added to major construction sites over the six months while 314 were removed.
The residential index increased from 150 to 166 points, while the non-residential index rose from 323 to 330 points.
Australian Bureau of Statistics data shows construction work reached $318 billion in 2025, up 3.8 per cent from 2024.
In 2025–2026, residential construction increased 8.1 per cent, including a 13.2 per cent increase in apartment and townhouse activity, while non-residential construction rose 9.3 per cent.
Engineering construction declined 0.6 per cent over the same period.
Nichols said residential construction was driving much of the growth in Melbourne and South-East Queensland, while Sydney was experiencing a reduction in residential activity.
Data centres, health infrastructure, major transport projects and other large-scale developments were also providing sources of construction activity across several markets.
Private-sector feasibility and financing constraints remained a factor for some projects, indicating that the national increase was not uniform across all segments of the construction industry.





