ConstructionStaff WriterWed 27 Sep 17
Crane Index Defies Predictions of Construction Collapse
A quarterly crane index has indicated that Australia's construction boom is not yet over, with 653 cranes sighted on working developments across Australia.
And according to Rider Levett Bucknall's (RLB) Q4 index, the residential sector continues to be dominant with 548 cranes representing 84 per cent of all cranes commissioned on future residential dwellings. The sector saw a net gain in crane numbers of nine since the last index.
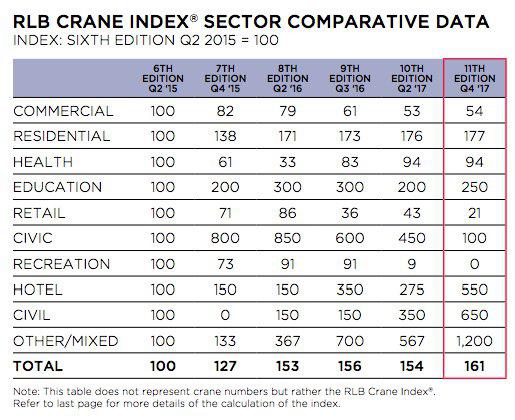
"The continuing strength of the construction sector within Australia is reflected in a 4% lift in the RLB Crane Index to a record level of 161. For the first time, RLB has created both an Australian residential and non-residential crane index to complement the overall index, which reflects the movement in crane numbers over time in these key sectors of the overall construction market." Ballesty said.
Non-residential more volatile
The non-residential index shows more volatility, but still highlights a positive trend. The index currently stands at 111 up from 101 in Q2 2016. These sectors are more volatile to large fluctuations in crane starts due to the smaller investor base for new developments and traditionally a single purpose use.
A stable non-residential sector is important to the industry as a whole, as it showcases new investment and confidence in both government spending on social infrastructure assets, and the private sector’s spend on long-term investments.
Of the 685 cranes standing tall across Australia, 350 were in Sydney, 151 in Melbourne, 85 across Brisbane, 31 in the Gold Coast, 25 in Perth, 18 in Canberra, 17 in Adelaide, 5 in Newcastle, 3 in Hobart, with 0 in Darwin.
Less high-rises in Sydney and Melbourne CBDs
“The two most buoyant markets of Sydney and Melbourne have seen a huge decentralisation of multi-level developments taking place. There are now 109 Sydney suburbs and 54 Melbourne suburbs with cranes, whilst other cities’ high-rise developments are focused in the CBD area.” Ballesty said.

Residential crane numbers soaring across Sydney
Residential cranes soared to 298 around Sydney, which amount to 43% of total cranes erected within Australia and 54% of all cranes supporting the residential sector in Australia.
109 suburbs in Sydney have residential cranes erected. The spread of cranes, highlighted in the heat maps within this edition, showcase the construction activity along the main northern, western and southern corridors of Sydney.
Sydney suburbs which currently have the most cranes include: Epping -- 16; Wolli Creek – 13; Parramatta – 10; Burwood -- 9; Mascot – 8; Homebush, Lane Cove, Lewisham and Zetland- all 7; Leichardt, Surry Hills – both 6; Ashfield, Auburn, Flemington, Meadowbank, Mosman, Ryde and Waterloo – 5.
A new high for Melbourne
Cranes across Melbourne now number 151, a new high, up from 146 in the previous edition, a net gain of 5 cranes. 88 cranes were added and 83 removed from sites.
Since the last index six months ago, there has been a move of cranes from the south to the east and west, highlighting the growth of higher density residential projects within these regions.
Commercial projects showed a small gain of one crane with 31 cranes on projects across Australia. This sector currently accounts for 5% of all cranes in Australia.
"The residential, hotel, civil, education and other/mixed use sectors all are showing strong growth in crane numbers with the remaining sectors all showing small losses since the last index," Ballesty said.
Main image copyright: hxdyl / 123RF Stock Photo


