ResidentialStaff WriterTue 16 Aug 16
Median House Price Nearly Seven Times Average Salary: HIA
This is an update of the HIA Economics note on dwelling prices which was released in November 2015.
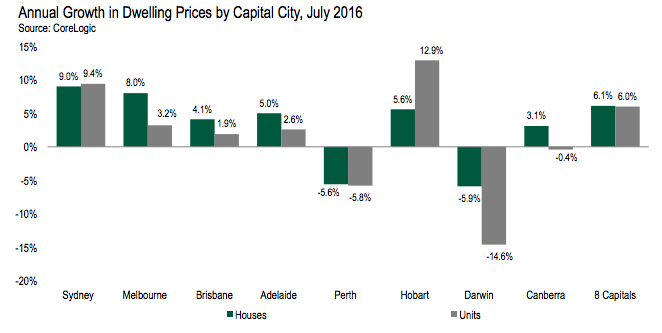
According to HIA's Report Dwelling Prices; What's the current state of play?, price growth has slowed across Australian capital cities with house prices up 6.1 per cent in the year to July 2016 and unit prices increasing by 6.0 per cent; since the low point in 2012, capital city house prices have increased by 40.0 per cent in aggregate while unit prices rose by 29.8 per cent.
Unit prices started to recover a few months earlier than house prices; Since bottoming out, the divergence between dwelling price growth in the different capital cities has been remarkably wide. The biggest uplifts have been in Sydney (+61.3 per cent) and Melbourne (+42.0 per cent). At the other end of the scale, Perth (-8.3 per cent) and Darwin (-12.7 per cent) prices have fallen substantially since peaking in 2014.
Despite the considerable variation during the current cycle, price growth across the capital cities has been quite uniform over the past two decades. In real terms, house prices have increased by 5.3 per cent annually compared with 3.9 per cent growth in unit prices.
The ratio of the median dwelling price to average earnings has increased substantially over the past two decades. Much of this is explained by structural changes in household size, economic participation rates, earnings patterns and the level of mortgage interest rates.
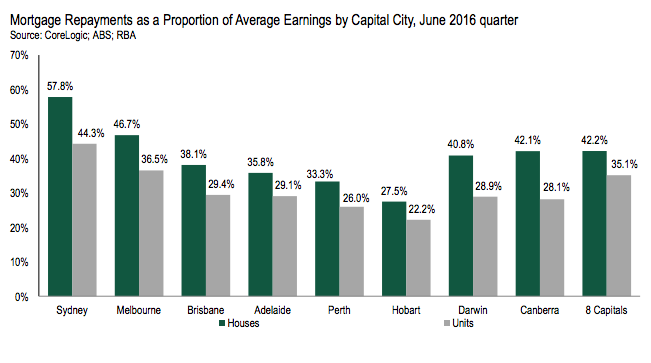
Source: HIADuring the June 2016 quarter, the price to earnings ratio was 6.96 for houses and 5.80 for units. The highest ratios were in Sydney and Melbourne, with the lowest in Hobart and Perth. With the exception of Sydney, affordability is more favourable than the 15-year average in all capitals. With respect to wider economic and financial conditions, dwelling prices across Australia appear to be proportionate. However, the wide geographical variation in current conditions means than some markets are likely to experience significantly stronger price growth than others over the medium term.
How the price upturn compares
Aggregated data for the eight capital cities indicate that dwelling prices bottomed out during May 2012 and have since expanded fairly consistently in all capitals apart from Perth and Darwin. The chart below summarises the cumulative increase in detached house prices in each market during the current cycle. Overall, detached house prices increased by 40.0 per cent across the eight capitals between May 2012 and July 2016. The largest house price rise occurred in Sydney over this period (+65.7 per cent), followed by Melbourne (+45.2 per cent) and Brisbane (+18.6 per cent). In contrast, house prices in Perth and Darwin have fallen back since reaching their peaks in 2014. Perth house prices have declined by 8.3 per cent while Darwin house prices are down by 11.8 per cent. Of the cities that have experienced consistent price growth, Canberra has seen the smallest increase in house prices since the 2012 trough (+13.0 per cent).
Price to earnings: the relative price of housing
While median disposable household income is the most conceptually sound indicator for benchmarking dwelling prices relative to income in the economy, the fact that these data are released only once per year with a long lag means that other measures must be utilised for more timely and frequent updates. Accordingly, this note uses average earnings as a barometer for household income due to the fact that earnings data are produced twice yearly (for the May and November ‘quarters’) in a relatively timely fashion. However, it is important to note that earnings data are an imperfect gauge of households’ financial resources, as no account is taken of direct taxation, unearned income (such as pensions, etc.) and income in kind.
Based on the average earnings data available from the ABS, the chart below provides an overview of the median dwelling price to earnings ratio across Australia since 1995, including data for detached houses and units. Over this period, the ratio has increased from 3.79 in the June 1995 quarter to 6.57. There is a reasonably large number of household income metrics with each having its advantages and disadvantages with respect to capturing dwelling affordability. As most are published just once per year with considerable lag, its relative timeliness and frequency gives the Average Weekly Earnings series from the ABS a significant advantage over other measures.
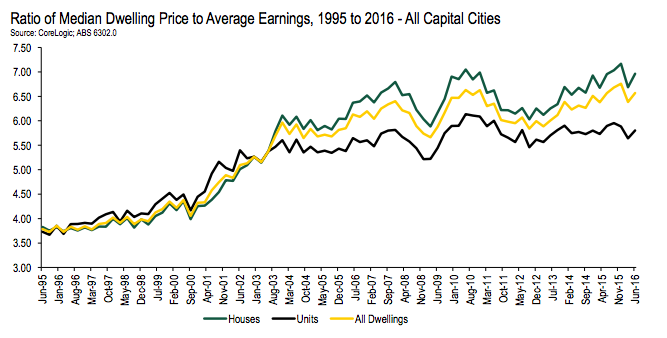
Source: HIAThe median detached house price is now 6.96 times earnings, compared with 3.83 in June 1995. On the unit side of the market, the price to earnings ratio has increased from 3.73 to 5.80. At first glance, this suggests that dwelling prices have lost touch with prices and incomes in the economy. However, the big uplift in the price to earnings ratio can largely be explained by two structural changes over the past 20 years.
Source: HIAFirst, the number of employees per household has risen significantly over the two decades due to higher female labour force participation rates, a trend towards taking retirement at older ages and changes in the structure of some households involving greater numbers of young professionals in ‘share’ housing. The secular reduction in interest rates over this period has also permitted dwelling prices to grow faster, due to the fact that homebuyers can affordably service much larger mortgages at current interest rates than was the case when the interest burden was much higher. It is worth noting that the RBA’s Official Cash Rate in August 2016 of 1.50 per cent is only one quarter of the 6.00 rate in August 2006 and an even smaller fraction of the 7.00 per cent cash rate of August 1996.
HIA's conclusion
The rate of dwelling price growth across Australia’s capital cities has slowed in recent months, with annual dwelling price growth easing to 6.1 per cent during July 2016. The variation in dwelling price growth across the capital cities continues to be large, with strong price growth in Sydney and Melbourne coinciding with falling prices in Perth and Darwin. Since the beginning of the price recovery nationally in 2012, house prices are estimated to have increased by 40.0 per cent across the capital cities, with growth of 29.8 per cent in capital city unit prices.
Source: HIAOver the long term, price trends tend to be quite similar from city to city with almost all cities experiencing real house price growth in the range of 4.3 per cent to 5.3 per cent yearly over the past 20 years. This means that the markets which experienced the weakest price growth over the past few years are more likely to perform strongly in the coming years, and vice versa. There is also a strong tendency for house prices to consistently outgrow unit prices over time, largely as a result of the larger land content. Dwelling price to earnings ratios are another useful gauge of valuations in different markets. Over time, the ratio of dwelling prices to average earnings has increased significantly across Australia.
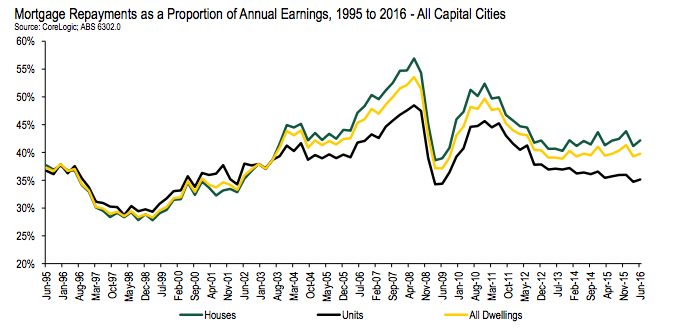
This change is justified by the large reduction in mortgage interest rates, as well as an increase in the number of earners per household. The price to earnings ratio is highest in Sydney and Melbourne and much lower in Hobart and Perth. This indicates that future price growth is likely to be much more limited in the largest capital cities given that current valuations are elevated. From the perspective of affordability, most markets are in a fairly favourable position. The mortgage repayment burden is lighter than its 15-year average in all capitals apart from Sydney. In Sydney, the affordability challenge is greatest on the detached house side although the repayment burden on units in the city is considerably lower.
Source: HIA“Dwelling prices: What’s the current state of play?”


