Home Ownership Down, Renters Up: ABS
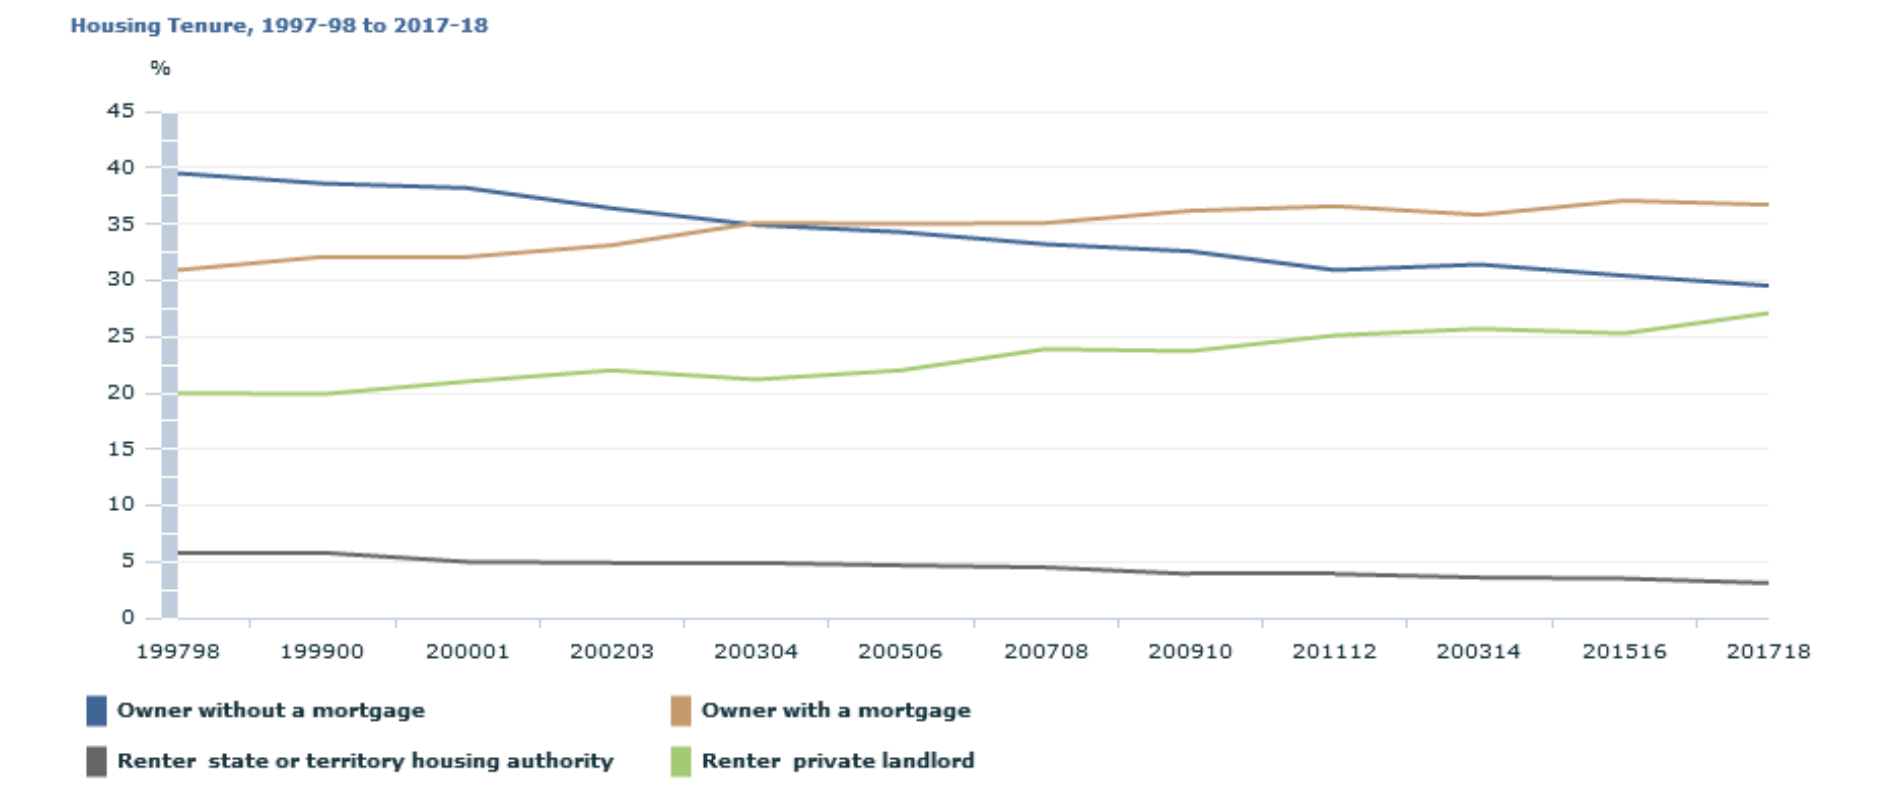
Twenty years ago about a quarter of Australians — 27 per cent — rented, but this figure has increased as the number of Australians owning their own home has fallen.
Home ownership has dropped from 70 per cent in 1997-98, down to 66 per cent in 2018-19, reveals new figures from the Australian Bureau of Statistics.
Over the same 20 year period, the proportion of households that owned their home mortgage-free, dropped from 40 per cent to 30 per cent.
The ABS’ 2017-18 Survey of Income and Housing report also reveals the proportion who owned their home with a mortgage increased from 31 per cent to 37 per cent.
ABS chief economist Bruce Hockman says housing costs, which covers rent payments, rate payments and mortgage or unsecured loan payments, have typically remained steady for most household types in comparison to recent years.
Renters paid $366 per week on housing, while owners with a mortgage paid $484 per week, on average, in 2017-2018.
“Interest rates have remained relatively low over the past several years and we have seen a recent softening in the rental market in some major cities,” Hockman said.
The median mortgage outstanding in Australia was $260,000, up from $238,000 in 2015–2016.

Rising number of renters in private market
The proportion of Australian households that rent increased to 32 per cent in 2017–18, a rise from 27 per cent in 1997–98.
Over the same 20 year period, the proportion of households renting a home from a private landlord increased to 27 per cent, up from 20 per cent.
While the proportion of public housing tenants dropped from 6 per cent to 3 per cent.
Hockman says most of the increase in renter households was recorded in the private rental market.
"Some of the decrease in public housing numbers can be attributed to recent trends in social housing provision which have seen the community housing sector taking on an increasingly prominent role."
Related: The Suburbs Cheaper To Buy Property Than Rent
The data shows that renters continue to devote more of their income to housing than home owners do.
“On average, private renters paid 20 per cent of their income on housing costs, compared to 16 per cent for owners with a mortgage and 3 per cent for households who owned their home outright.”
The data also shows lower income households spent a larger proportion of their income on housing.
“On average, lower income households renting privately paid $339 per week which was 32 per cent of their gross weekly income,” Hockman said.
“Lower income households who owned their home with a mortgage paid on average $376 per week which was 29 per cent of their gross weekly income.”
New South Wales
64 per cent of NSW households own their own home (down from 67 per cent in 2015–16).
35 per cent own with a mortgage
30 per cent own without a mortgage (down from 32 per cent in 2015–16).
34 per cent were renting (up from 31 per cent in 2015–16)
Victoria
68 per cent of Victorian households own their own home
37 per cent own with a mortgage
31 per cent own without a mortgage
29 per cent were renting
Queensland
63 per cent of Queensland households own their own home
35 per cent own with a mortgage (down from 39 per cent in 2015–16)
27 per cent own without a mortgage
36 per cent were renting
South Australia
69 per cent of SA households own their own home
37 per cent own with a mortgage
32 per cent own without a mortgage
30 per cent were renting
Western Australia
70 per cent of WA households own their own home
43 per cent own with a mortgage
27 per cent own without a mortgage
28 per cent were renting
ACT
64 per cent of ACT households own their own home
40 per cent own with a mortgage
25 per cent own without a mortgage
34 per cent were renting
Northern Territory
59 per cent of NT households own their own home
42 per cent own with a mortgage
17 per cent own without a mortgage
39 per cent were renting
Tasmania
72 per cent of Tasmanian households own their own home
39 per cent own with a mortgage
33 per cent own without a mortgage
26 per cent were renting.


