ResidentialEliza OwenThu 11 Feb 21
The House Always Wins: Homes Outstrip Unit Sales
In the year to January, Corelogic estimates that there were 459,308 properties transacted across Australia—most of these sales were houses, rather than units.
It is not unusual for house sales to make up the majority of transactions, with houses making up an average 70.2 per cent of annual sales volumes over the past decade.
However, the share of houses as a portion of sales increased to 74.2 per cent in the year to January 2021, up from 73.2 per cent a year ago and 66.7 per cent five years ago.
Another way of thinking about it, is that for every 1 unit sold over the year, there were 2.9 house sales.
Portion of total national sales (houses)
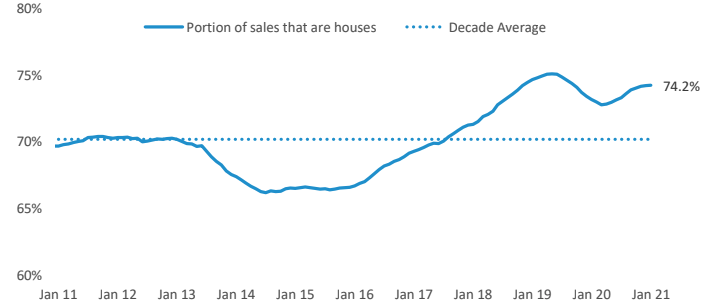
^Source: Corelogic
The table shows the portion of sales over the year that were houses, compared with the decade average, for various regions.
Most capital city and rest of state regions saw the portion of house sales elevated in the year to January, compared with the decade average.
The general uplift in the share of sales that were houses through the year to January may be attributed to a few of factors.
The introduction of HomeBuilder may have skewed demand toward houses.
Since the announcement of HomeBuilder in June, new home sales have increased significantly.
According to the HIA, new home sales in the December 2020 quarter were almost 100 per cent higher than in December 2019.
However, the design of the scheme largely lent itself to new houses, as opposed to units.
An example of this was the tight timelines for eligibility, where the commencement of a new property initially had to take place within three months of the contract date.
This meant the take up of the scheme was largely utilised for detached houses, rather than off the plan unit sales, with the latter requiring a number of purchaser commitments before the project commences.
This trend was reaffirmed in ABS dwelling approval data, where approvals for house builds were up 13.9% in the year to December 2020, compared with an -8.6% decline in units approvals.
Corelogic sales volumes only count new properties as sold upon settlement, so the portion of new home sales over 2020 may continue to trend even higher once new house builds are completed.
Portion of total sales (houses)
| Greater capital city / rest of state region | Portion of annual sales that are houses - January 2021 | Portion of annual sales that are houses - decade average |
|---|---|---|
| Sydney | 58.3% | 53.5% |
| Melbourne | 67.9% | 65.8% |
| Brisbane | 77.0% | 71.0% |
| Adelaide | 78.7% | 79.5% |
| Perth | 82.1% | 79.4% |
| Hobart | 74.1% | 74.5% |
| Darwin | 67.1% | 66.3% |
| Canberra | 63.5% | 63.0% |
| Regional NSW | 83.4% | 82.2% |
| Regional Vic | 88.2% | 87.2% |
| Regional Qld | 74.1% | 68.3% |
| Regional SA | 93.9% | 94.3% |
| Regional WA | 92.8% | 90.7% |
| Regional Tas | 87.6% | 86.4% |
| Regional NT | 78.0% | 73.2% |
^Source: CoreLogic. Note these calculations are based on modelled estimates of settled sales, and final sales numbers may revise over time. The estimated do not properties sold off the plan that are yet to settle.
Investor lending was low, and investors may prefer units
The value of finance commitments for the purchase of investment property, as reported by the ABS, has a stronger positive correlation with unit sales than houses.
Comparing a decade of sales volumes with investor finance commitment values produced a correlation coefficient of 0.74 with units, and 0.48 with houses.
This could be because investors have historically outweighed owner occupiers across the unit sector.
Over 2020, the average value lent to investors for the purchase of property was $5.1 billion per month. This is 22.7 per cent below the monthly average in the past decade.
The relatively low levels of investment activity may have been compounded by weak rental markets, particularly in highly- concentrated investment markets like inner-city Sydney and Melbourne, which are largely comprised of unit stock.
House sales rise as a percentage of total sales when prices fall
Continued falls in investment financing does not entirely explain the fall of units as a share of total sales.
After all, April to June 2019 marked the period where house sales had reached the highest concentration of sales over the decade, at 75.1 per cent.
During this time, the value of investor lending was low, but not at its lowest.
What did happen during that time however, was a bottoming out in housing values nationally.
When houses become more affordable, they may become increasingly preferable to units.
Similarly, an increase in house prices, such as has been observed in recent months, may pivot demand back to units, where purchase prices are generally lower and housing affordability less challenging.
Based on this reasoning, there are headwinds for house sales in the year ahead; the end of the HomeBuilder scheme, a recovery in investor lending levels and rising house prices could challenge the popularity of detached dwellings over the year.
But there are arguments for desirability of detached dwellings in 2021.
Anecdotally, houses have offered reprieve from density during a pandemic, and remote working arrangements have allowed people to seek relatively affordable houses in regional Australia.
Another consideration is that unit rents have seen weaker performance than houses over the year, which may see investor demand gravitate toward houses.
First home buyers may also continue to drive house sales, as Sydney and Melbourne house values sat -2.7 per cent and -6.5 per cent below the respective peaks as of January.


