Vanessa CrollThu 05 Dec 24
Uptick in Property Listings After Spring Slowdown

Australian residential property listings climbed in November as the housing market faced a muted end to the spring selling season, the latest data shows.
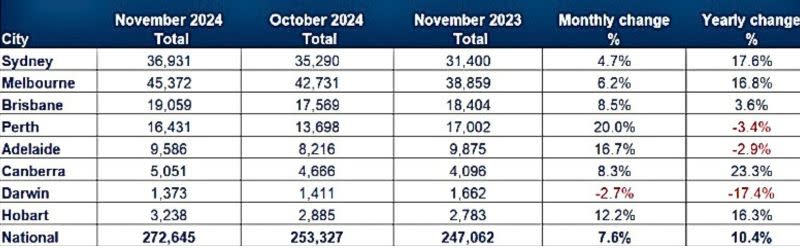
National residential property listings rose by 7.6 per cent over the month to reach 272,645 properties, according to SQM Research.
The increase was largely driven by older listings and properties on the market for 30 to 90 days, indicating slower turnover during what is typically a peak selling period.
SQM Research managing director Louis Christopher said the spring selling season had not met expectations, with much of the rise in listings attributed to unsold stock rather than fresh activity.
“This will be slightly disappointing news to many real estate agents who were counting on a stronger selling season than what has actually happened,” Christopher said.
Year-on-year, total listings nationally increased by 10.4 per cent.
Perth recorded the largest monthly increase in listings, up 20 per cent, followed by Adelaide, where listings rose by 16.7 per cent, and Hobart, which posted a 12.2 per cent increase.
Canberra and Brisbane had more moderate monthly gains of 8.3 per cent and 8.5 per cent, respectively.
Melbourne recorded a 6.2 per cent increase, while Sydney rose 4.7 per cent.
Darwin was the only capital city to record a decline, with listings falling by 2.7 per cent for the month.
Asking prices fell across capital cities, with averages down by 0.8 per cent.
House prices declined by 0.2 per cent nationally, while unit prices rose slightly by 0.4 per cent.
Sydney and Melbourne saw combined house and unit asking price declines of 0.9 per cent and 0.7 per cent, respectively.
Total property listings, November 2024
Adelaide recorded the strongest growth in asking prices, with a 2.3 per cent increase, followed by Perth at 1.2 per cent and Brisbane increasing by 0.2 per cent.
New property listings—properties on the market for less than 30 days—decreased by 0.4 per cent nationally to 82,138 properties, an unusual decline for November, a month typically seeing stronger new listing activity.
Older listings—more than 180 days—climbed by 6.4 per cent to 74,119 properties.
Distressed listings—seeking urgent sale due to financial or personal pressures—increased by 1.7 per cent nationally, with the ACT seeing the sharpest rise at 33.3 per cent.
“Clearly the housing market has slowed down, particularly in Sydney and Melbourne where we are recording lower vendor confidence as measured by our asking prices index which feel a further 0.9 per cent for Sydney and 0.7 per cent for Melbourne,” Christopher said.
“New listings are very likely to fall away in the lead up to Christmas with the typical hiatus period occurring between December 23 to Australia Day.”
He said while the first major auction weekend would likely be February 1, summer holiday locations such as the Gold Coast tended to have their busiest period in January.


