Sponsored ContentPartner ContentFri 14 Apr 23
Why Greenfield’s Population Growth Matters

After the release of the Census data in 2022, location intelligence experts GapMaps delved into the data to share insights into the 24 highest population greenfield growth areas in Australia.
In this article, associate director of GapAdvisory Fraser Brown unpacks that research.
Based on key demographic factors such as income growth, age profile, ethnicity, and birthplace, GapMaps assessed which growth areas may or may not be more attractive to physical location network planners and property developers.
As part of the analysis, we identify the growth areas that have a store provision lower than the national average in key retail sectors. This includes quick service restaurants and fast food, health and fitness, childcare centres, dental clinics, petrol stations, supermarkets, and medical centres.
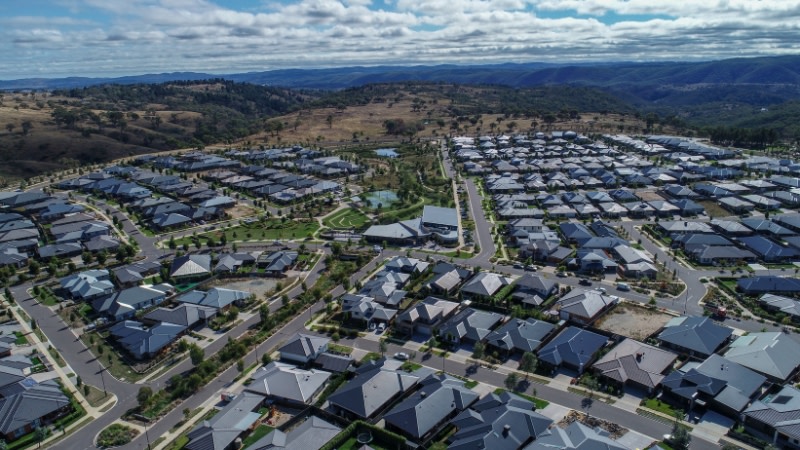
Greenfield residential
Greenfield residential areas have and continue to play a key role in the country’s population growth. We identified 24 major growth areas that collectively contributed more than a third of Australia's population growth between 2016 and 2021.
Across Melbourne, the major greenfield growth corridors housed 89 per cent of metro Melbourne’s new residents between 2016 and 2021 and now accommodate 17 per cent of Greater Melbourne’s total population.
Sydney has higher levels of residential densification within the inner and middle rings, and therefore the greenfield growth corridors accounted for a lower but still substantial 56 per cent of population growth over 2016-21, with these corridors accommodating 5 per cent of metro Sydney’s population.
The two major greenfield growth fronts in Sydney, the North-West Growth Area (+69,300) and South-West Growth Area (+60,400), along with Cranbourne (+55,700) in outer south-eastern Melbourne, recorded the highest levels of population increase, with each growing more in aggregate terms than the entire ACT (+50,500). North-West and South-West Sydney each more than doubled their population level between 2016 and 2021.
The three other outer-Melbourne regions of Craigieburn (+46,000), Tarneit (+33,600) and Wollert-Mernda (+28,500), along with the Northern Gold Coast (+28,000) also experienced very strong aggregate growth.
Two of the smaller, emerging growth areas of Ripley Valley (Qld) and Googong (NSW, bordering ACT) grew the fastest in percentage terms, with their populations increasing by 27 per cent and 26 per cent per annum respectively, albeit from smaller population bases.
North-West and South-West Sydney, Cranbourne and West Dapto–Calderwood (Illawarra, NSW) also achieved growth in excess of 10 per cent per annum.
Across the 24 assessed growth areas, the average rate of growth was 7.4 per cent per annum, about six times the Australian average of 1.2 per cent per annum.
But not all growth is equal and while population growth drives market size, there are several other factors to consider when preparing a network strategy, store rollout program or development assessment.
Among the most important socio-demographic factors to consider are income (how affluent is this area?); age (what is the predominant life stage this market is in?); and ethnic profile (are my brand and the customer aligned?).
Income growth
Werribee recorded the fastest growth rate in household income levels, with average household income increasing by 24 per cent between 2016 and 2021. This is well above the national average, which was 16 per cent over the same period.
Meanwhile, Tarneit, Cranbourne, Pakenham, and West Dapto–Calderwood have also seen rapid growth in average household incomes, with increases of more than 20 per cent in each case. Each of these areas has seen an increase in the share of professional workers among its residents, in fact all areas have become increasingly white collar since 2016.
Of the 24 assessed growth areas, 20 have average household incomes that are above the national average. Googong, North-West Sydney, Northern Canberra, South-West Sydney, Point Cook and Springfield Lakes stand out, with average household incomes more than 20 per cent above the national average in each case.
Age profile
The average age of residents within the 24 growth areas is 31.5 years, much younger than the Australian average of 38.9 years.
The populations of Ripley, Googong and Springfield all have average ages below 30, highlighting the popularity of these areas with young families and first home buyers.
Between 2016 and 2021, 15 of the 24 growth areas, typically the more recently developed ones, recorded a decrease in average age (i.e. there was an increase in children and young families).
Ethnicity and birthplace
Australia’s greenfield growth areas are becoming increasingly cosmopolitan, with an increasing proportion of overseas born residents observed in most growth areas, though Byford, Yanchep, and Alkimos (all in Perth) recorded small declines in representation of overseas born residents.
Tarneit and Point Cook, in Melbourne’s Wyndham Local Government Area, have the highest representations of overseas born residents, each with more than 50 per cent of residents born overseas.
It is not unusual for specific growth areas to attract large numbers of overseas born migrants from one country, thereby forming a large enclave of that group. Point Cook, for example, is highly popular with Indian-born migrants while Craigieburn, in Melbourne’s outer north-west is a focal point for Iraq-born residents.
Across the 24 growth areas, around 39 per cent of residents were born overseas, which 11 per cent higher than the Australian average and 4.6 per cent higher than was the case in 2016.
Clearly overseas migration has been a key driver of population growth within these growth corridors and had the pandemic not put a pause on migration in 2020, it is likely that the share of overseas born residents would be even higher.
With borders now open and net overseas migration rebounding strongly, these areas will continue to see strong growth in residents born overseas.
Store and facility provisions
So what does this mean for retailers and developers looking to create new retail and service destinations?
Supply generally lags behind demand in greenfield growth areas, as population thresholds take time to establish. This pattern makes these areas attractive to retailers and developers with an appetite for first mover advantage and to establish themselves in an area in the early stages of development.
We’ve compared the provision of gym and fitness clubs, fast food and QSR outlets, childcare, medical centres, dental clinics, petrol stations and supermarkets across these growth areas with the respective national and capital city benchmarks. Most of these growth areas are undersupplied in all of the retail and services categories assessed.
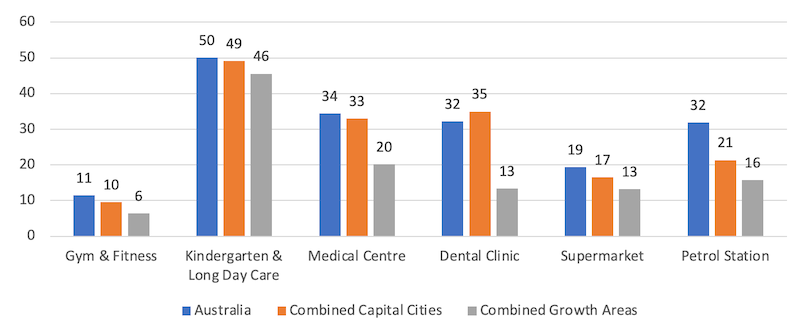
The chart below shows the average provisions (per 100,000 residents) for the combined growth areas against national and capital city averages for each type of store/service. The results show there are significant opportunities within these growth areas, most of which are currently undersupplied and have strong and continuing future growth prospects for many years.
Store-Facility Provision per 100,000 residents
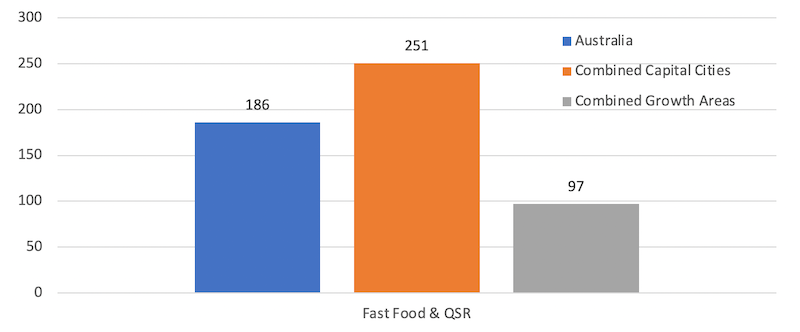
Store Provision per 100,000 residents
Of the 24 growth areas assessed:
18 have a provision of childcare facilities below the national average
19 have a provision of gym and fitness clubs below the national average
20 have a provision of supermarkets below the national average
21 have a provision of medical centres below the national average
23 have a provision of dental clinics below the national average
23 have a provision of petrol stations below the national average
22 have a provision of fast food and QSR outlets below the national average.
Overall, population growth in greenfield growth areas presents a significant opportunity for retailers and developers.
By targeting areas with high levels of population growth, income growth, and cultural diversity, businesses can position themselves to capture a significant share of the growing consumer base, build customer relationships and drive brand awareness, sales and profitability.
Finally, to succeed in this competitive and rapidly evolving market, network planners need to understand the differing demographic characteristics in each area and tailor the brands’ offerings to meet its unique needs and preferences.
These growth areas will soon be released onto the GapMaps Live platform, helping you to accurately identify site and development opportunities over a longer-term horizon.
To find out more about GapMaps Live visit www.gapmaps.com or contact us to schedule a demo with our team.
The Urban Developer is proud to partner with GapMaps to deliver this article to you. In doing so, we can continue to publish our daily news, information, insights and opinion to you, our valued readers.


