
Eliza OwenFri 22 Jan 21
Regional Returns in a League of Their Own
There has been no shortage of reporting about the relatively strong performance of regional Australian dwelling markets over 2020.
December home value data showed the combined regional dwelling market increased 6.9 per cent in value over the year; a growth rate more than three times the rate of the combined capital cities.
But even more impressive than value changes in 2020, is the return that some areas have shown in the longer term.
Rolling annual growth in dwelling values
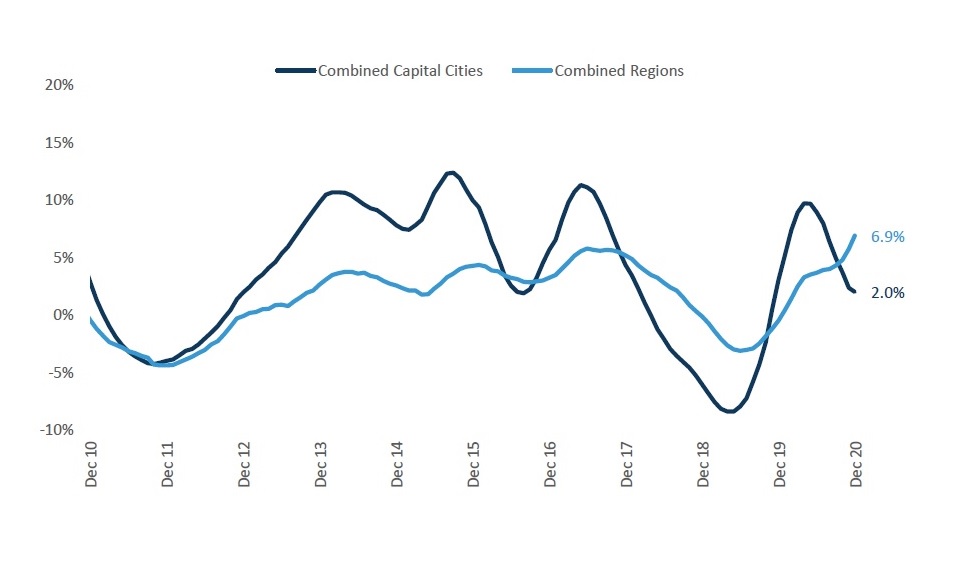
^Source: Corelogic
This can be seen when looking at 10 year annualised growth rates, which is what growth in an asset value would be if it had the same growth rate every year for 10 years.
By this metric, some secondary cities’ have performed just as well as, if not better than, their capital city counterparts. This is a particularly prominent trend across the eastern seaboard.
This set of charts shows that 10 year annualised growth rates in large, coastal dwelling markets are closer to the performance of capital city sub markets than the rest of regional Australia.
In NSW, 10 year annualised growth rates were 5.0 per cent across Illawarra, and 4.5 per cent across both the Newcastle Lake Macquarie region, and the Southern Highlands and Shoalhaven region.
This compares to an average of 5.1 per cent across the Sydney sub markets, and an average of just 2.1 per cent across the rest of regional NSW.
In Victoria, Geelong has a long run annualised growth rate of 4.1 per cent, which is also closer to the average of the capital cities (3.7 per cent) than the rest of regional Victoria (2.7 per cent).
Across Queensland, the Gold Coast and Sunshine Coast have seen long term growth rates align more closely with average increases across the capital city sub markets (1.5 per cent).
But further to this, the 10 year annualised growth rates have surpassed the increases in every other capital city and regional sub market across the sunshine state.
10 year annualised change in dwelling values: NSW
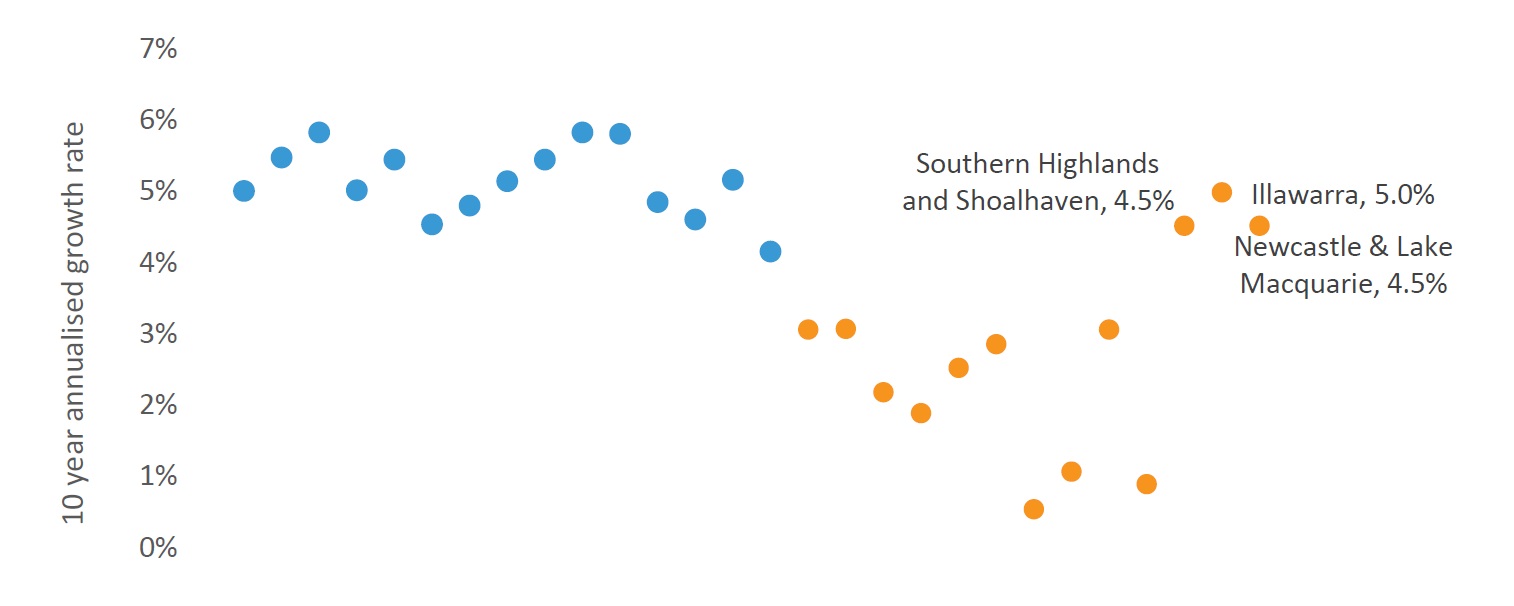
^Source: Corelogic
10 year annualised change in dwelling values: Vic
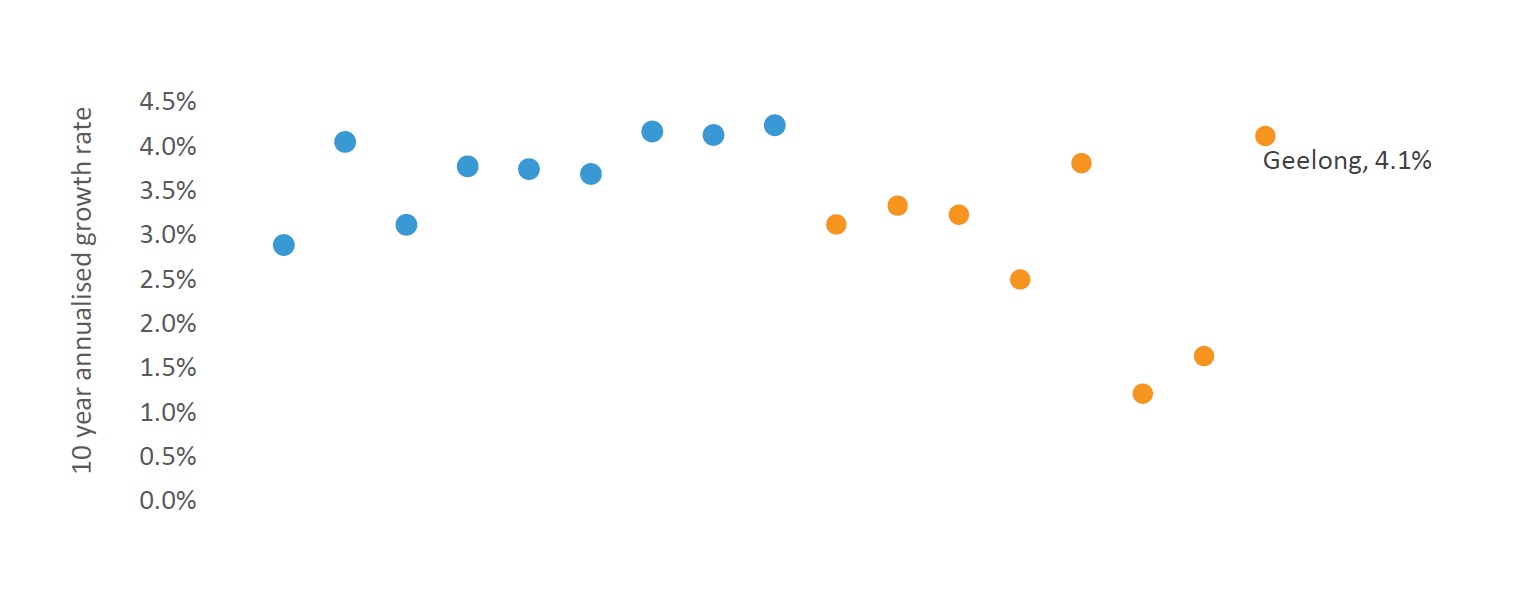
^Source: Corelogic
10 year annualised change in dwelling values: Qld
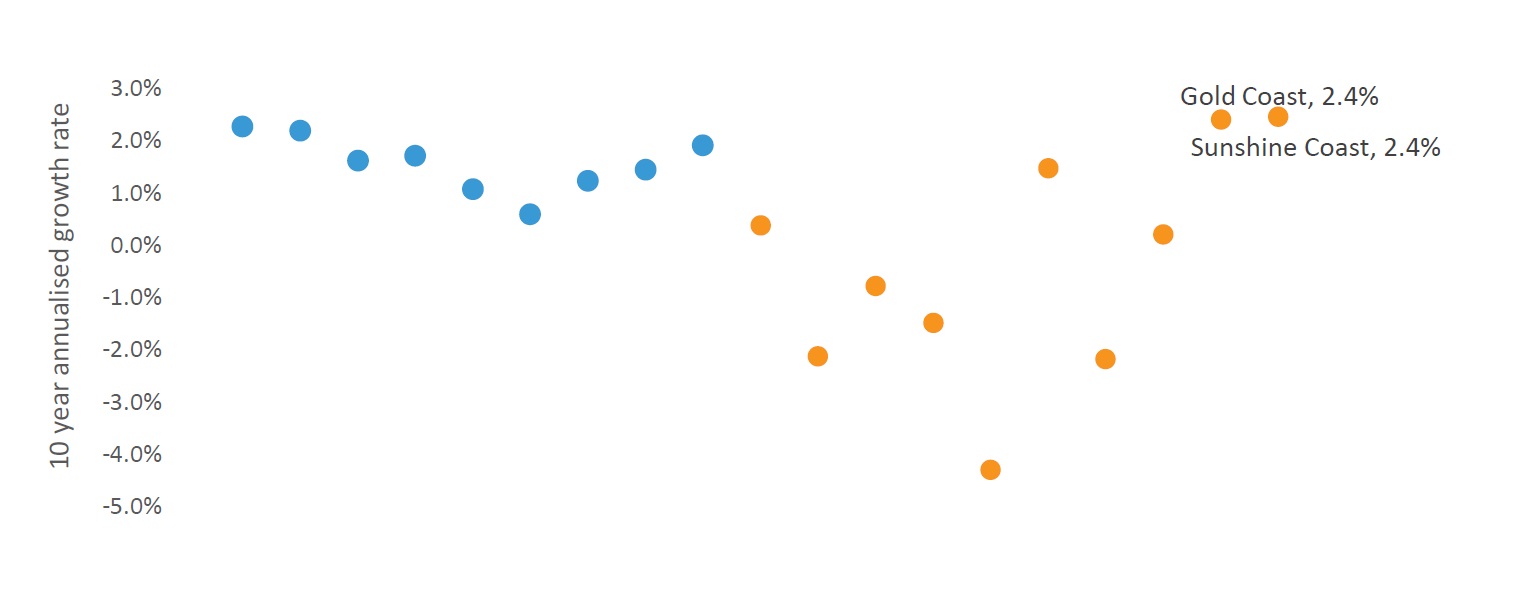
^Source: Corelogic
Covid may have exacerbated the trend, but did not start it
Why have major coastal markets performed so well in the past decade?
A major driver of dwelling market value increases comes from population growth.
Out of 88 sub markets across Australia, the Gold Coast and Sunshine Coast have seen the highest volume of net internal migration, or arrivals minus departures from other parts of the country, for the three years to June 2019.
Over this time, these markets gained 39,770 additional residents from other parts of Australia.
While the trend of moving from capital cities to regional Australia is nothing new, Covid -19 may have exacerbated the desirability of regional Australia.
This may be because relatively strict restrictions were implemented across major capital cities, and remote work has been increasingly enforced as a way to combat the spread of Covid-19.
But population growth is unlikely to be the only factor at play.
The Illawarra region attracted just 718 additional residents internally in the three years to June 2019, but has one of the highest annualised 10 year returns of regional Australian dwelling markets.
One of the reasons for the longer term popularity of markets major coastal centres could be proximity to major cities.
The rise of cities within a "commutable distance" to the capital cities have enabled a regional lifestyle with the benefit of maintaining access to the employment opportunity and amenity of the capitals.
This combination has attracted a greater price premium over time. Previous notes have also reflected on the idea that nearby coastal markets may rise in value as capital cities become less affordable, creating a "spill over" of demand as people are priced out of cities.
With a positive outlook in place for housing assets in 2021, regional Australian dwelling markets may continue to rise in val ue. Looking back, these results suggest the best long term returns are not always found in the capital city dwelling markets.


