ConstructionLindsay SaundersWed 27 Sep 23
Australia’s Crane Numbers Soar to Record Highs

Crane numbers on constructions sites across Australia have soared, according to the latest data.
Led by Sydney, and the Gold and Sunshine coasts, 46 new cranes have been added to the nation’s skylines in the past six months, according to Rider Levett Bucknall’s biannual RLB Crane Index.
Rider Levett Bucknall Oceania director of research and development Domenic Schiafone said the Australian construction industry had experienced a huge six months with crane numbers rapidly expanding across the country.
“There have been 303 new cranes added to projects and 257 removed from buildings nearing completion in the period,” he said.
“The number of cranes across the major regions has hit a record 882, an increase of 5.5 per cent since our last publication,” he said.
The large number of cranes observed correlates with national activity, according to RLB.
Total construction activity across Australia for the 2022 calendar year was up by 1.8 per cent, or $3.9 billion, compared to 2021, according to the Australian Bureau of Statistics. Construction activity in the first quarter of 2023 continued this trend, rising 3.9 per cent, or $2.1 billion, year-on-year.
“Looking around the country, Sydney continues to be the main driver of crane activity,” Schiafone said.
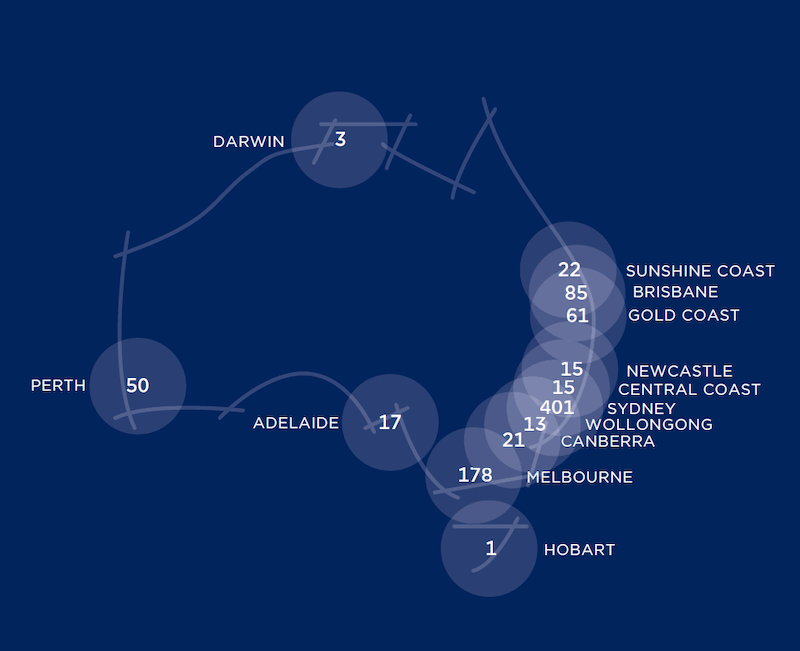
“Of the 882 cranes sighted across Australia, 401 were in Sydney, 178 were in Melbourne, 85 in Brisbane, 61 on the Gold Coast, 50 were in Perth, 22 in the Sunshine Coast, 21 in Canberra,17 in Adelaide, 15 in the Central Coast, 15 in Newcastle, 13 in Wollongong, 3 in Darwin and 1 in Hobart.”
According to RLB, the residential index reached a record high of 178, up two index points from the previous high of 177 in the third quarter of 2017.
This index represents 554 cranes, up from 530 in the last count—176 cranes were added to residential projects with 152 removed from sites.
The non-residential index rose from 266 to 285 index points, the second highest level recorded.
Cranes on non-residential sites now number 328. This is 22 more cranes than the 306 counted in the first quarter of this year.
The non-residential proportion of cranes across the country is 37 per cent, the same proportion as the last count.
Eight cities recorded higher crane numbers for 2023’s third quarter.
The number of cranes in Sydney increased by 10 per cent to break the 400-crane mark for the first time, making Sydney the first Australian city to record this achievement.
Cranes within Sydney now number 401—a rise of 36 cranes.
The projects with the largest number of cranes in Sydney include: One Sydney Harbour (six cranes at Barangaroo), Westconnex (five cranes at Rockdale), Western Sydney Airport (four cranes at Badgerys Creek), Mason & Main Merrylands (four cranes), and Vicinti & Destination (four cranes at Macquarie Park).
The Gold Coast RLB Crane Index continued its upwards rise, increasing from 373 index points to a new peak of 407 points. A total of 15 cranes were added across the region, with 10 cranes removed.
The Sunshine Coast RLB Crane Index increased to a record 220 index points, a significant growth on the 160 index points recorded 12 months ago. The region saw the removal of six cranes and the addition of eight cranes, to record a total of 22 cranes.
“Since the start of the pandemic (first quarter, 2020), total cranes within Australia have increased by 22 per cent or 160 cranes,” Schiafone said.
“This has been largely driven by increases in Sydney (102) and the South-East Queensland region (Brisbane 27, Gold Coast 28, and the Sunshine Coast 11).
“When comparing current and historical crane numbers for Melbourne, Sydney, and nationally, it is evident that Melbourne’s crane activity is falling.
“Melbourne’s count of 182 cranes is marginally above the average of 174 since first quarter, 2015.
“Current crane numbers in Sydney and nationally are well above their respective averages of 310 and 708.”
Melbourne cranes account for 20.2 per cent of all cranes in Australia, followed by South-East Queensland with 19 per cent of all cranes.
The gap between Sydney and Melbourne crane numbers has widened significantly during the past six editions.
RLB Crane Index Third Quarter 2023