ConstructionMarisa WikramanayakeThu 06 Apr 23
Downswing Hits Crane Count as Peak Passes

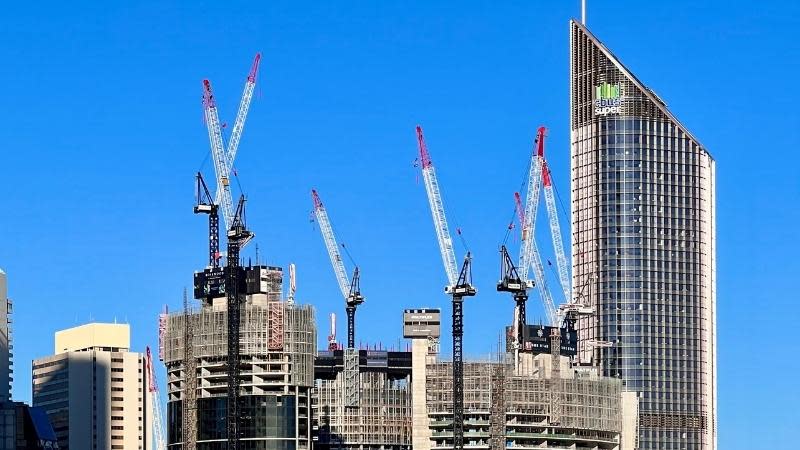
The number of cranes on our cities’ skylines is the second highest on record, but the peak may have passed.
Global quantity surveyor Rider Levett Bucknall’s Crane Index for the first quarter of 2023 reported that the number of cranes nationally was 835, the second highest figure since the index began in 2012.
That figure is down 3.8 per cent on the previous quarter’s record 868.
Crane numbers are an indication of the level of major construction work under way.
“The continuing strong number of cranes observed correlates with the strong national activity numbers,” Rider Levett Bucknall Oceania research and development director Domenic Schiafone said.
In the past six months, 300 cranes ceased work on projects nearing completion while 292 cranes began work on new projects.
Generally, construction activity remains high with the Australian Bureau of Statistics reporting that work during 2022 had increased by 0.7 per cent or $14 billion nationally compared to 2021.
However, rising construction and material costs and labour shortages as well as the impact of the cost of living crisis continues to dog the sector.
The index showed that during the past six months, activity was highest in the civic, civil and educational sectors while 532 cranes are at work on projects across the country.
Schiafone said the non-residential sector had fallen from its record high of 290 to 264 for this edition.
Crane numbers have fallen in the Hoddle Grid, Docklands and Southbank areas of Melbourne, declining to 26 cranes from the 68 in the third quarter of 2019.
In Sydney, 15 cranes were removed, a drop of 4 per cent, to 365, however it is still the second highest number for the city on RLB’s records.
Work starting on the Powerhouse Museum in Parramatta helped Sydney’s numbers stay as high as they did.
Melbourne CBD cranes fell to 189, down from the previous quarter’s 189.
Brisbane had 77 cranes, down from 82; Perth was steady with 51; Adelaide had 18, up from 17; Canberra 17, down from 23; Newcastle 9 down from 12, Wollongong 16, up from 15; and Hobart’s halved from 2 to 1.
The Gold and Sunshine coasts added four cranes each to be at 56 and 20 respectively, the Central Coast has 13 in operation and Darwin doubled its crane numbers to four.
Schiafone said changing lifestyle and hybrid employment choices were key factors and that less development in Melbourne was going to have other effects.
“The continuous reduction in crane numbers within Melbourne’s CBD district may be a contributing factor of the decrease of public transport patronage within Melbourne,” Schiafone said.
“Lower levels of crane activity highlighting lower levels of construction activity within the CBD may be contributing to the lengthening of the awakening of the district.”


