Deflation, Interest Rates Support House Prices
Adjusting for a strong rise in inflation takes some shine off the recent value increases seen across smaller capital city housing markets in the September quarter.
This is because factoring inflation into the rate of capital gains of dwelling values provides an important perspective that is often overlooked.
Housing is an integral part of Australian household wealth, and has been identified as a key source of equity for funding aged care and health care later in life.
Therefore, inflation can affect the real value that be accessed through property over time.
The latest Consumer Price Index results from the Australian Bureau of Statistics showed a 1.6 per cent increase over the September quarter—the highest quarterly result since 2006.
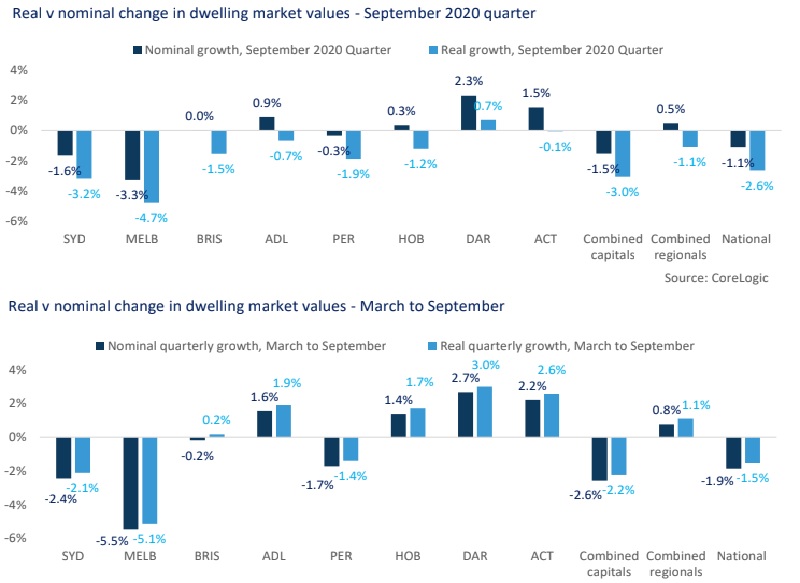
When taking headline inflation numbers into account for the September quarter, real (inflation adjusted) changes in house prices showed declines across seven of the eight capital city markets, and the combined regional markets.
Darwin was the only capital city market to exhibit real dwelling value growth, at 0.7 per cent.
Real v nominal change in dwelling market values

^Source: Corelogic
However, the 1.9 per cent decline in headline inflation through the June quarter, which was not fully recovered by the September result, has reduced the real decline in property values through the pandemic compared with the nominal result.
Nominal declines in national dwelling values were 1.9 per cent between the end of March (when stage 2 lockdowns were rolled out across Australia), and September.
However, adjusting for the deflationary period in June, real dwelling values fell only 1.5 per cent.
While annual inflation has been weighed down to 0.7 per cent, real growth in national dwelling values was 4.1 per cent in the year to September.
Cash rate reductions, which are anticipated through November, are prompted by a low inflationary environment, but simultaneously increase demand for property, and typically push prices higher.
Despite the initial correction in home values that came with high uncertainty and a slowdown in economic activity, residential real estate values show signs of stabilising, or even increasing.
A particular challenge through the current period may be for those trying to save for a deposit to buy property, particularly for first home buyers who do not have existing property to draw on for sale or equity.
On the one hand, low inflation erodes the value of savings at a more gradual pace. But with the cash rate potentially hitting new record lows in November in an attempt to lift inflation, deposit rates for savings accounts are likely to be further compressed.
This could see first home buyers trying to enter the market with increasingly low deposits, meaning more debt, which in a low inflationary environment, is harder to pay off over time.
What does inflation tell us about real returns in different areas over time?
Growth in housing across Australia at the macro level has broadly outpaced inflation, creating real returns for property owners across Australia.
In the June 2020 Pain and Gain report, it was noted the median return for resales on property held for 30 or more years had a nominal profit of $569,000.
On the median resale through the June quarter, this amounted to a real return of $230,000.
The table below summarises the nominal versus real returns on capital city dwelling values over a 10 and 20 year period.
The 10 year real return highlights the weakness in long term returns from mining-related markets like Perth and Darwin.
It also highlights that the growth in the Brisbane market over the past 10 years can be largely attributed to inflation.
City dwelling markets nominal vs real returns
| City | Nominal 10yrs | Nominal 20yrs | Real 10yrs | Real 20yrs |
|---|---|---|---|---|
| Sydney | 60.2% | 181.% | 33.0% | 76.3% |
| Melbourne | 38.1% | 228.6% | 14.7% | 106.2% |
| Brisbane | 11.7% | 172.3% | -7.2% | 70.8% |
| Adelaide | 14.8% | 169.2% | -4.7% | 68.9% |
| Perth | -16.2% | 109.7% | -30.4% | 31.5% |
| Hobart | 41.7% | 240.4% | 17.7% | 113.5% |
| Darwin | -25.6% | 61.5% | -38.2% | 1.3% |
| Canberra | 23.0% | 199.6% | 2.1% | 88.0% |
| Combined Capitals | 34.2% | 186.0% | 11.4% | 79.4% |
| Combined Regionals | 15.1% | 145.8% | -4.4% | 54.2% |
| Australia | 29.7% | 176.2% | 7.7% | 73.3% |
^Source: Corelogic
Over a 20 year period however, each capital city dwelling market has returned growth higher than inflation.
Real returns for housing in Australia increased from the late 1980s, driven by deregulation in the financial system, increased globalisation and relatively low levels of supply to strong population growth.
Stubbornly low inflation against a low interest rate environment may continue to boost real returns for home owners, but could exacerbate the challenge for non-home owners to get on the property ladder.


